

| Help | |||||||||||||||||||||||||||||||||||||||||||||||||
|---|---|---|---|---|---|---|---|---|---|---|---|---|---|---|---|---|---|---|---|---|---|---|---|---|---|---|---|---|---|---|---|---|---|---|---|---|---|---|---|---|---|---|---|---|---|---|---|---|---|
3Omics help3Omics overview
|
| Type of Analysis | Correlation analysis |
Co-expression analysis | Phenotypic analysis | KEGG pathway enrichment analysis | Gene ontology enrichment analysis |
|---|---|---|---|---|---|
| T-P-M | Yes | Yes | Yes | Yes | Yes |
| T-P | Yes* | Yes | Yes | No | Yes |
| P-M | Yes* | Yes | Yes | Yes | No |
| T-M | Yes* | Yes | Yes | Yes | Yes |
| T | Yes | Yes | Yes | No | Yes |
| P | Yes | Yes | Yes | No | No |
| M | Yes | Yes | No | Yes | No |
* The missing omics will be derived from literature.
Input files for 3Omics 
CSV Files
Our system accepts the input of CSV (comma separated values) files. A comma-separated values or character-separated values (CSV) file type is a simple, text format representation of a database table. Each record in the table is one line of the text file. Each field value of a record is separated by a specified delimiter.
Preparing CSV files for Transcriptomics, Proteomics, and Metabolomics data
CSV files are stored as plain-text which can be edited by any text-processing tool. For convenience, we recommend to use a spreadsheet application to prepare the CSV file. The image below displays the format of CSV data in a spreadsheet application, e.g., Microsoft Excel. For reference, here are a few example input files: Transcriptomics data, Proteomics data and Metabolomics data/Metabolomics overall data.
(a)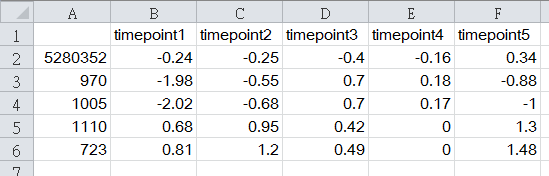
Preparing for running 3Omics
Example files
Example files of transcriptomics, proteomics, metabolomics data are available below:
Transcriptomics example: Transcriptomics CSV file
Proteomics example: Proteomics CSV file
Metabolomics example: Metabolomics CSV file
Metabolomics overall example: Metabolomics overall data
Correlation network setting
The parameter of correlation network is used to control the appearance of edges and distance between nodes. The parameter setting panel is on the left side of the corrleation network page. The correlation network is already present with these default values:
Correlation Coefficient Threshold: 0.9
Repulsion: 160
Attraction: 80
The Correlation Coefficient is used to control the appearance of the edges. If the Pearson's correlation coefficient between two molecules is larger than 0.9 (the default), the edge will be displayed between two molecules. Repulsion and Attraction are parameters of the Force-directed layout algorithm in aiSee3. For more details, please see the manual of aiSee3: Attraction and Replusion.The current settings are adjusted for better visualization. However, they can be adjusted by altering the value on parameter setting panel.
Pathway enrichment Analysis
What's the different between Normal Mode and Enrichment Mode?
The normal mode of Pathway enrichment analysis maps the user's metabolite input into the KEGG/HumanCyc Pathway database. The result of normal mode shows the number of hits from each pathway that correspond to the supplied metabolites. The user is required to upload only one metabolite list.
The enrichment mode of KEGG/HumanCyc Pathway enrichment analysis require a user to upload two metabolite lists; one is the overall metabolite list, and a significant/differential expressed metabolite list. The significantly enriched pathways are identified by a hypergeometric test among a given list of metabolites. For a given KEGG/HumanCyc human pathway, m metabolites are the subsets of N metabolites mapped in the given pathway. The q metabolites are the subset of n metabolites with significant changes, and x metabolites are mapped to the given pathway with significant changes. The cumulative possibility of x metabolites mapped to the given pathway is calculated by a hypergeometric distribution. The probability for x or more metabolites mapped to the given pathway can be calculated according to formula (1)
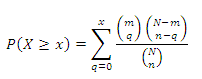
Formula 1. (1)
(a)
(b) 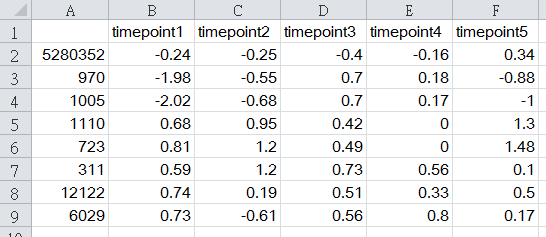
Figure 2. (a) The significant/differential expressed metabolite list
(b) The overall metabolite list
Exporting files
Correlation network
The image of correlation network can be downloaded through the icons links in the top-right corner. Currently, SVG and original size of PNG format files are provided. Simple Interaction File (SIF) is also provided with node/edge attributes. SIF can be imported and visualized in Cytoscape.
FAQ
File format, naming and column header naming rules
3Omics can accept any file name with CSV extension (E.g. Transcriptome.csv). The first column is the ID of each molecule. The second and following columns are the expression of different time points or experiments (treatments or control). The header of column may be named freely.
Name to ID converter
The identifiers of input molecules are requested as the identifiers of public databases, such as NCBI Gene ID/UniProt ID/KEGG Compound ID. In order to facilliate molecular names convertion, we provide a simple tool for converting common names to NCBI Entrez Gene ID/UniProt ID/KEGG Compound ID.
To use the name-to-ID converter, please prepare the list of gene names/protein names in a single file with each molecule name on a single line. Upload the file in the converter, and the result will be returned.